
Habit & Consistency
0d
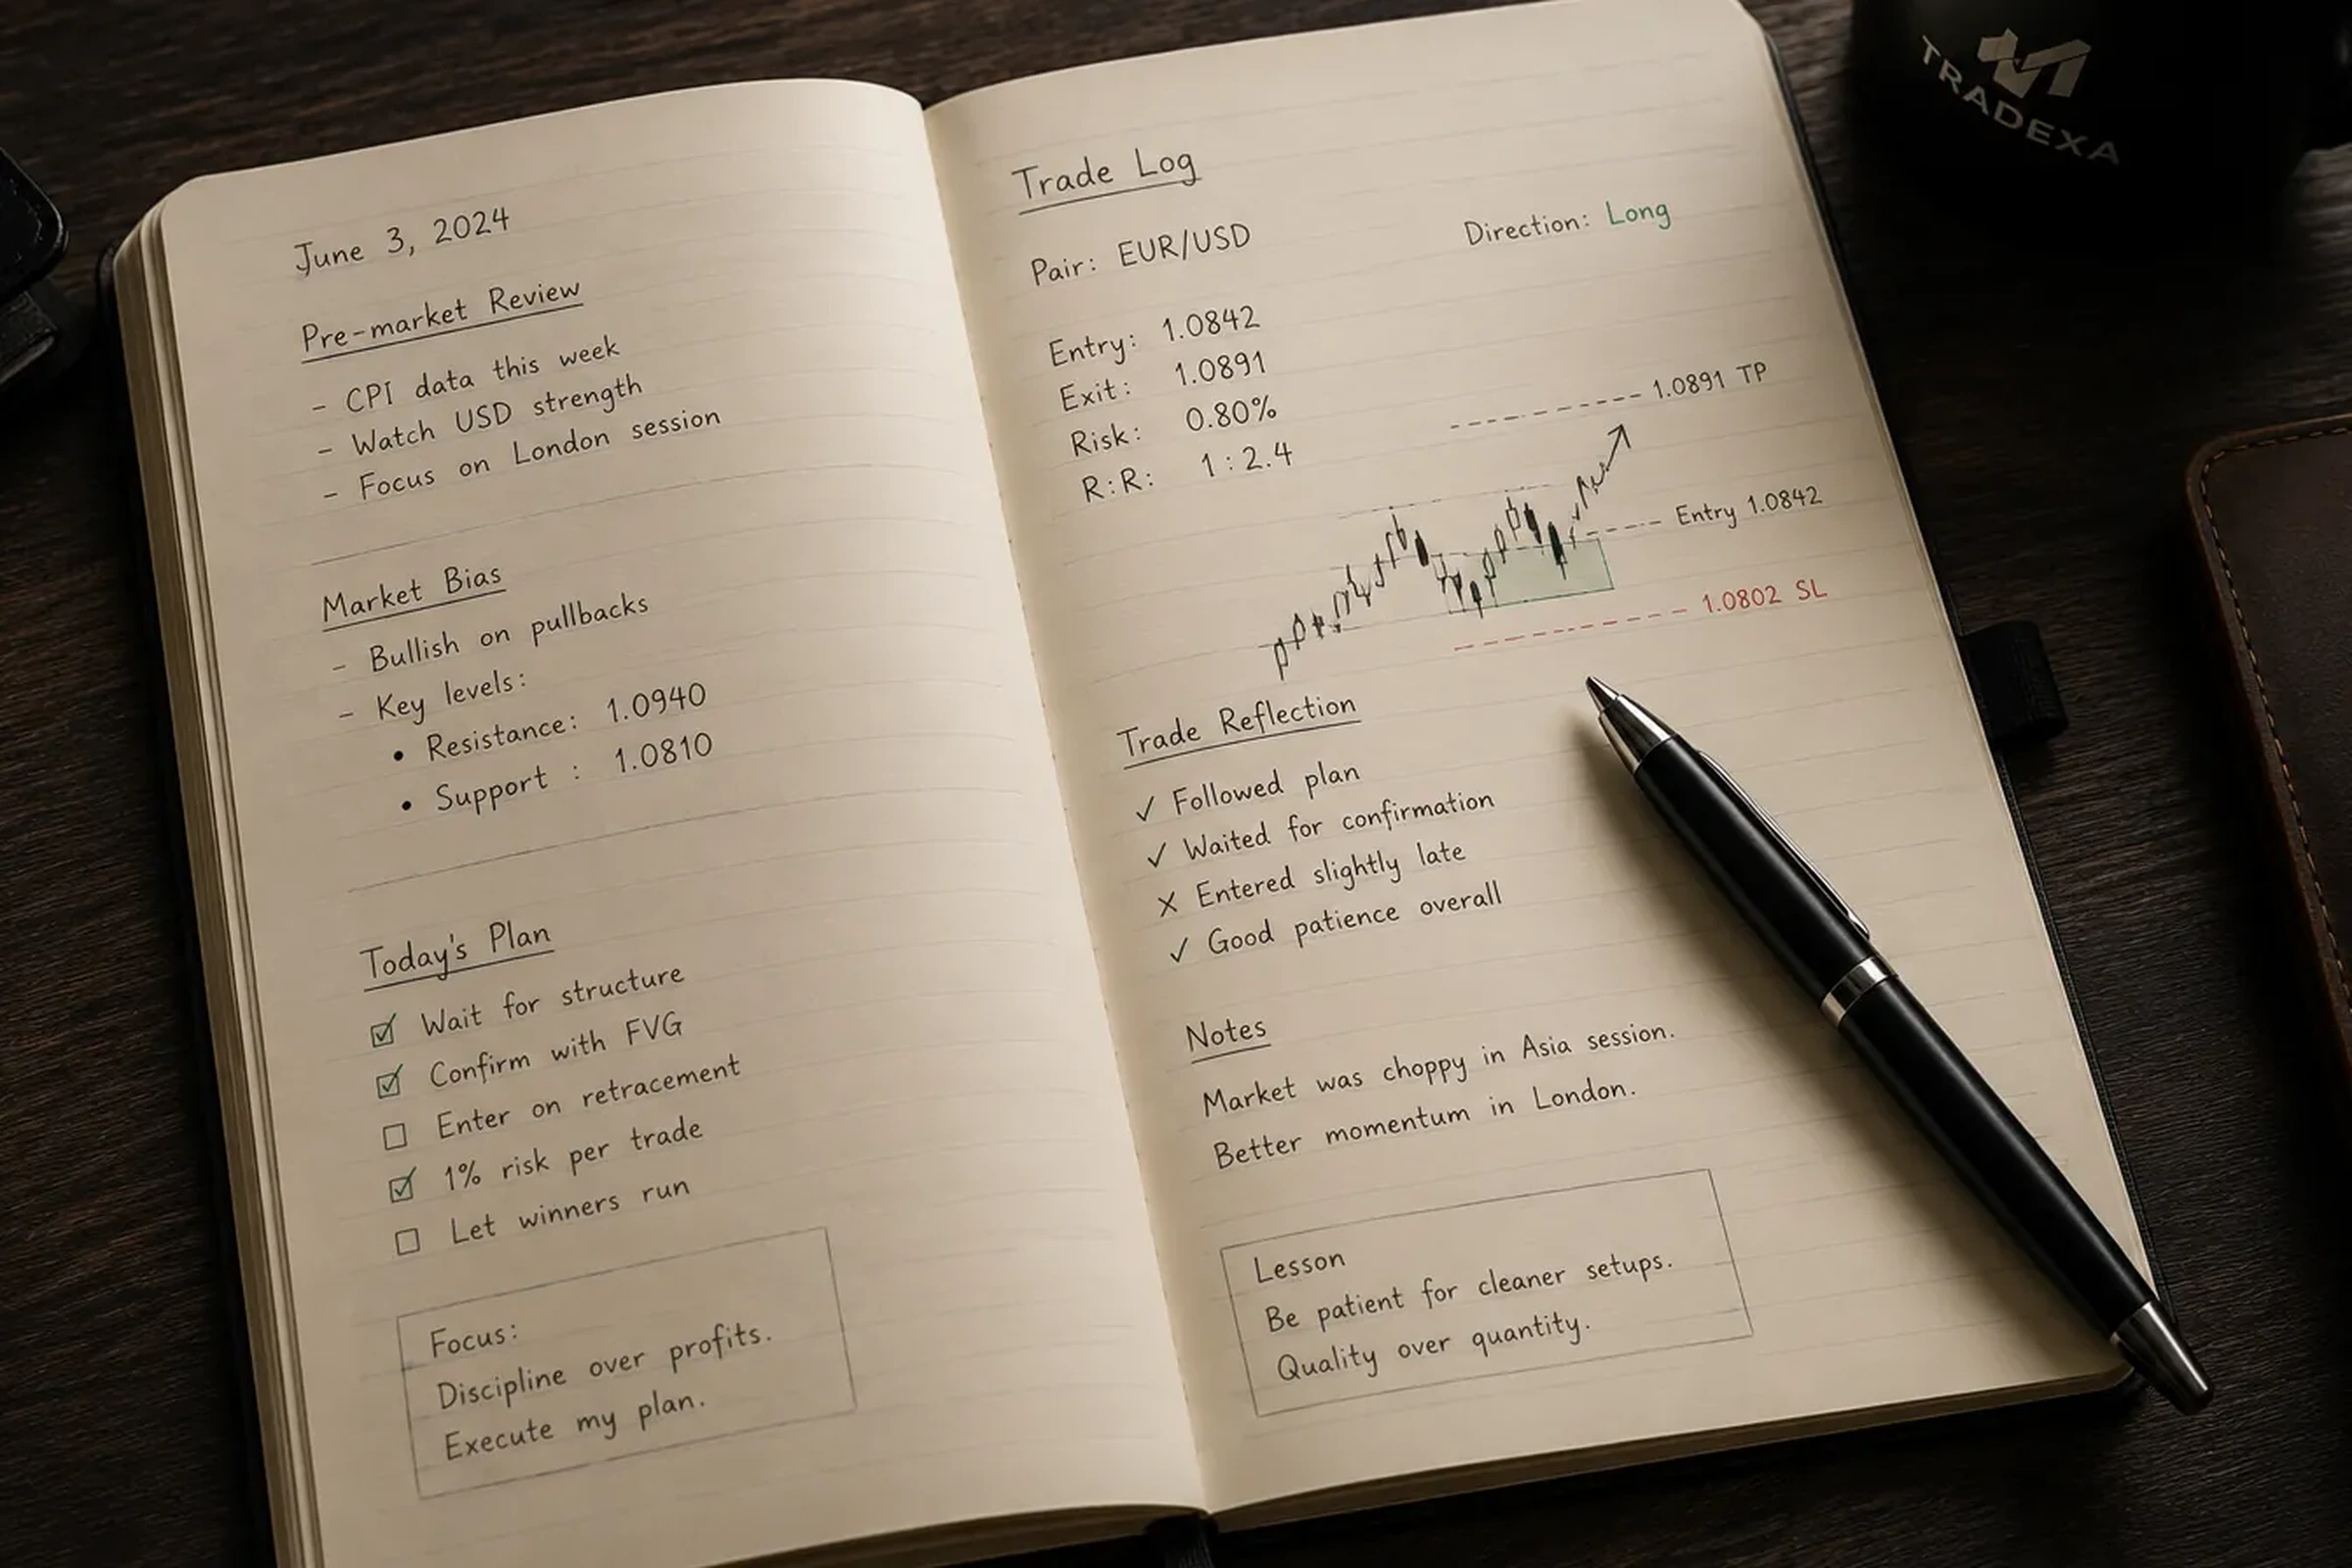
Logging Streak
✓ Logged today
From random sessions to a daily habit.
Log every trade. Review every session. The discipline compounds quietly in the background.